Network Topology 5.4.0 — every cable gets its own line
This release came out of an issue, and the person who reported it built it himself. Christos Diamantis described what was missing; two days later the pull request was there, with tests that are stricter than mine. It’s the first structural change to the module that isn’t mine.
Two switches, four cables, one line
Up to 5.3 the rule was: one device pair, one edge. If a switch reported the same neighbour a second time on a different port, that report was folded into the edge that already existed. First value wins.
For a LACP bundle that meant three things, and the third is the real problem:
You saw one port name — one out of four on a 4×10G. You saw the traffic of one member, measured against that member’s capacity, so 10G instead of 40G, and a utilisation figure that looked far worse than reality. And when a cable failed, nothing on the map changed. The line stayed, because the other three were holding it up. The exact moment you hang a topology map on the wall for was the moment it went quiet.
Now every cable is an edge
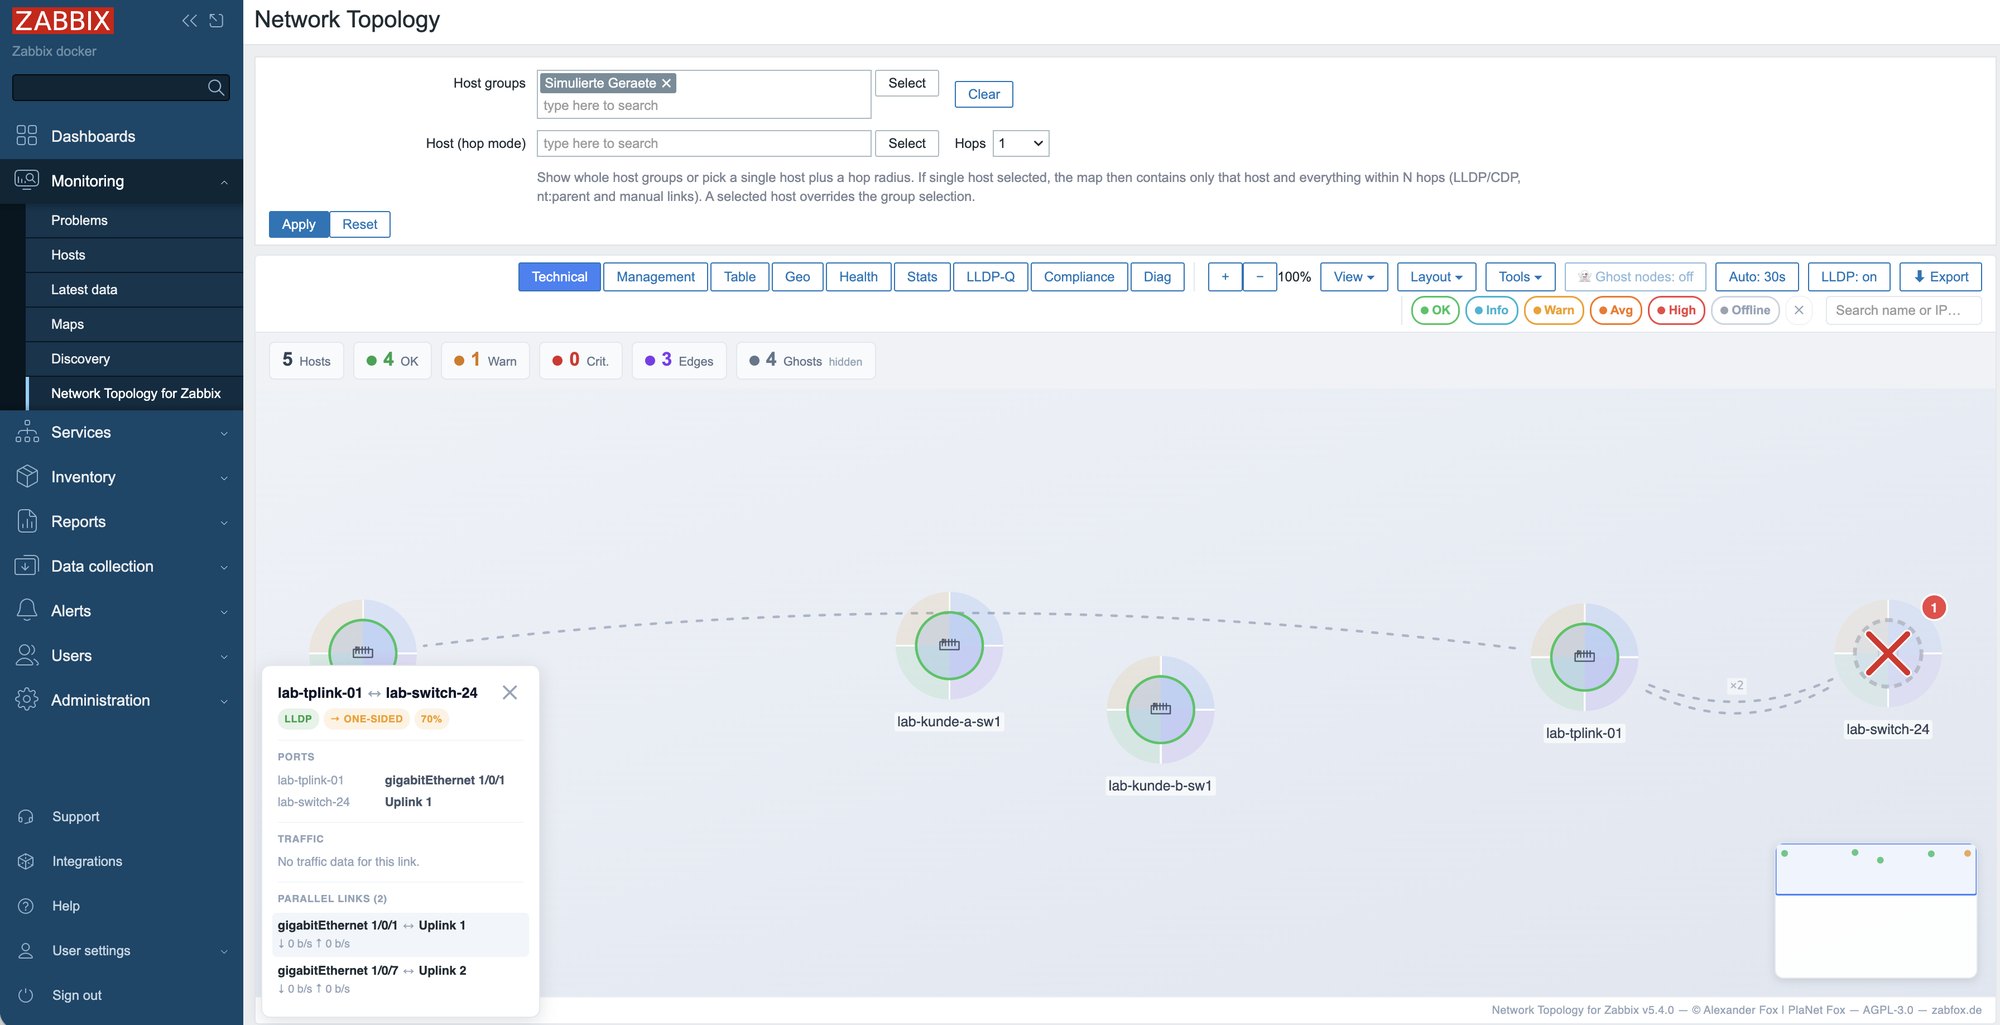
Zoomed in, the bundle fans out: one curve per cable, side by side, each with its own ports at both ends, its own traffic, its own utilisation. A member that stops being reported while its siblings carry on is a red dashed line right between the live ones.
Zoomed out, the bundle collapses into one line marked ×4, with the totals of both ends and an
amber glow for as long as a cable is dead. If you run a meshed core with six cables between every
pair, you can switch the fanning off entirely — then it stays one line with a count on it, always.
That default is Christos’, and it’s better than the one I had written into the roadmap. On a zoomed-out map nobody wants more lines; when you zoom in, you want every cable separately. This serves both without anyone flipping a switch.
The expensive mistake isn’t the missed cable
The same wire gets reported from both ends, and the two ends rarely agree on what the port is
called. One switch says 10101, the other GigabitEthernet1/0/1, and LLDP and CDP happily number
the same local port differently. Turn that naively into “different port, therefore different
cable” and you draw every such wire twice.
So the rule is deliberately cautious: a report only opens a new member once the same device has already reported every known member over the same protocol, on other ports. The number of lines is therefore right even when the labels can’t be compared. What can be wrong is the pairing — which far-end port belongs to which near-end port — never the count.
And the notification finally says which cable
A failed bundle member is a change report of its own now. Before, it would have said “link core ↔ acc disappeared”, and that is simply false while three of four cables carry the link. A sentence like that sends someone to the server room for nothing, and the next time they won’t believe it at all.
Now it reads:
cable core Gi1/0/1 ↔ acc Te1/1/1 gone — 3 of 4 still up
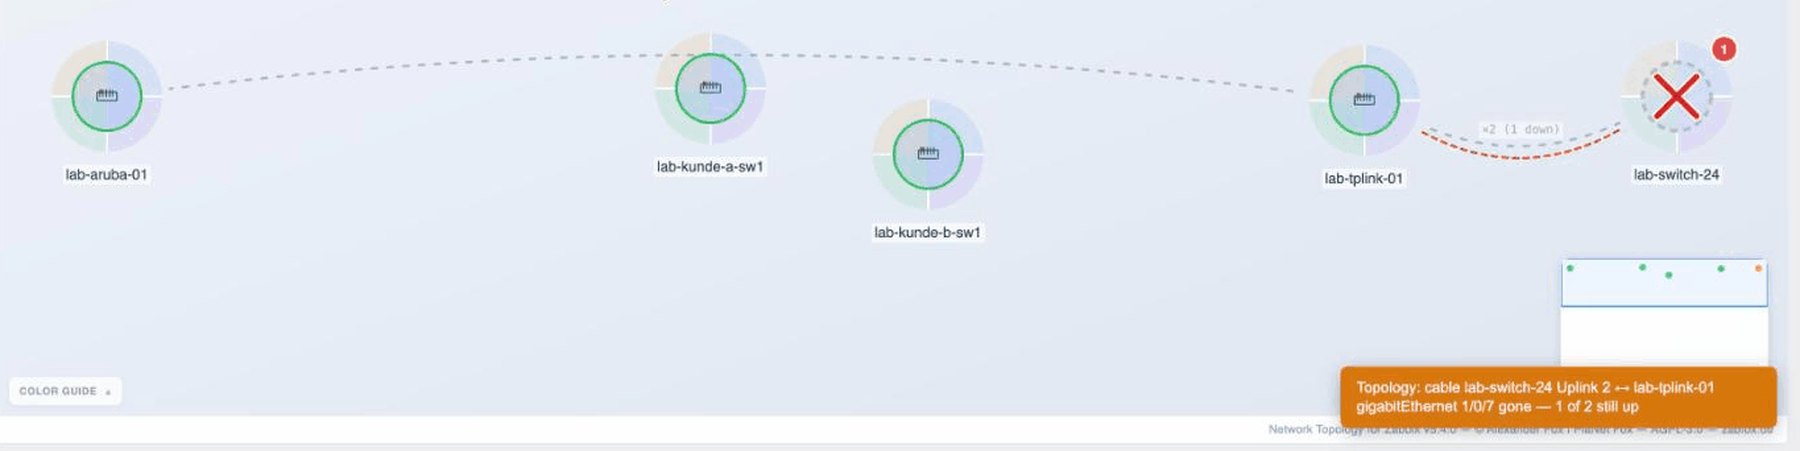
And when the last one goes, “the link is down”. A single wire keeps the short, old wording — “cable 1 of 1 gone” would not be an improvement.
Which port is that thing on?
That’s the question most people arrive with. The access point is dead and somebody wants to bounce
its PoE port: get on the switch, show lldp neighbors, hold it against the port descriptions, find
the one that’s missing.
Since 5.3.2 a click on the device answers it in the panel. Now the answer is a column in the table
as well: the far-end device and port, sortable, filterable (port:Gi1/0/8 in the search box), and
exportable through the new CSV button. That turns the table into a patch list you can print and
hold against your documentation — device and port land in two separate columns in the file, because
a spreadsheet wants to group by switch and sort by port.
The nicest part is a side effect: edges don’t vanish, they age. So for a device that is already gone, the port it last hung on is still there, with a small clock next to it. Which is exactly the port being looked for.
What else went in
An ifSpeed of 4294967295 is not a speed, it’s the ceiling of a 32-bit counter: a 10G port reports
exactly that number and puts the truth in ifHighSpeed. The panel said “0.0 % of 4.3 Gb/s”, and
every utilisation percentage on such a link was computed against the same wrong figure. That value
is discarded now; without ifHighSpeed the speed stays unknown rather than invented.
Red edges meant the host, not the link. The colour came from a ratio across all interfaces of both endpoints — on a switch with 17 of 31 ports unused but administratively up, that’s over half, so every one of its links glowed red while the panel next to it showed zero errors for the port in question. The state of the port the edge actually hangs on decides now.
Also in: port names that only showed on one side. An “auto” layout that reused a saved arrangement covering 30 of 157 drawn nodes. And the ghost filter is called “without endpoints” instead of “network gear only” — and says so when it has nothing to filter because no neighbour reports its capabilities.
The dashboard tiles
The topology widget still draws one line per device pair — a tile is too small for a fan. But it
counts the cables now instead of quietly dropping them: ×4, and ×4 (1 down) when one is dead.
And a correction on my own account: since July this site said the widgets need Zabbix 7.4 and hang
on “Loading…” on 7.0. That no longer holds. On a 7.0.30 all five now sit on one dashboard and
render — the map including its ×2, KPI, health score, table and items. What went wrong on 7.0.28
in July I have not established. The explanation I wrote next to it back then (“the widget JS base
class differs”) was wrong in any case: the class is identical on both versions, method for method.
Runs where?
Zabbix 7.0 LTS and 7.4, AGPL-3.0, no build tools needed. Tested on 7.0.30, 7.4.12, 7.4.14 and 7.4.15. Updating from 5.3.x: replace the files, reload php-fpm, one hard refresh. No Scan directory, no template change.
Two things you’ll notice right away. A device pair with several cables is several lines from now on
— if that’s too much in a meshed core, turn View → All parallel links off. And the first refresh
after the update is loud: the comparison baseline knew one key per pair and now knows one per cable,
so a bundle of four announces three “another cable” notices. Once, per user, then it’s quiet.
Thanks
To Christos Diamantis for the issue and the pull request — for the rebuild itself, for the tests, and for having a better default than the one I’d sketched. And to the reporter who mailed me screenshots and a Latest data list: four of the fixes above came out of that single thread.