Network Topology 5.5.27 — find every device on its port
Main module and all five dashboard widgets run on Zabbix 7.0 LTS and 7.4. Grab it here: github.com/linuser/zabbix-network-topology/releases
The 5.5 post stopped at 5.5.2 — faster, nosier, suspicious. Since then it has grown up to 5.5.27: two bigger things and a long clean-up wave. The short version.
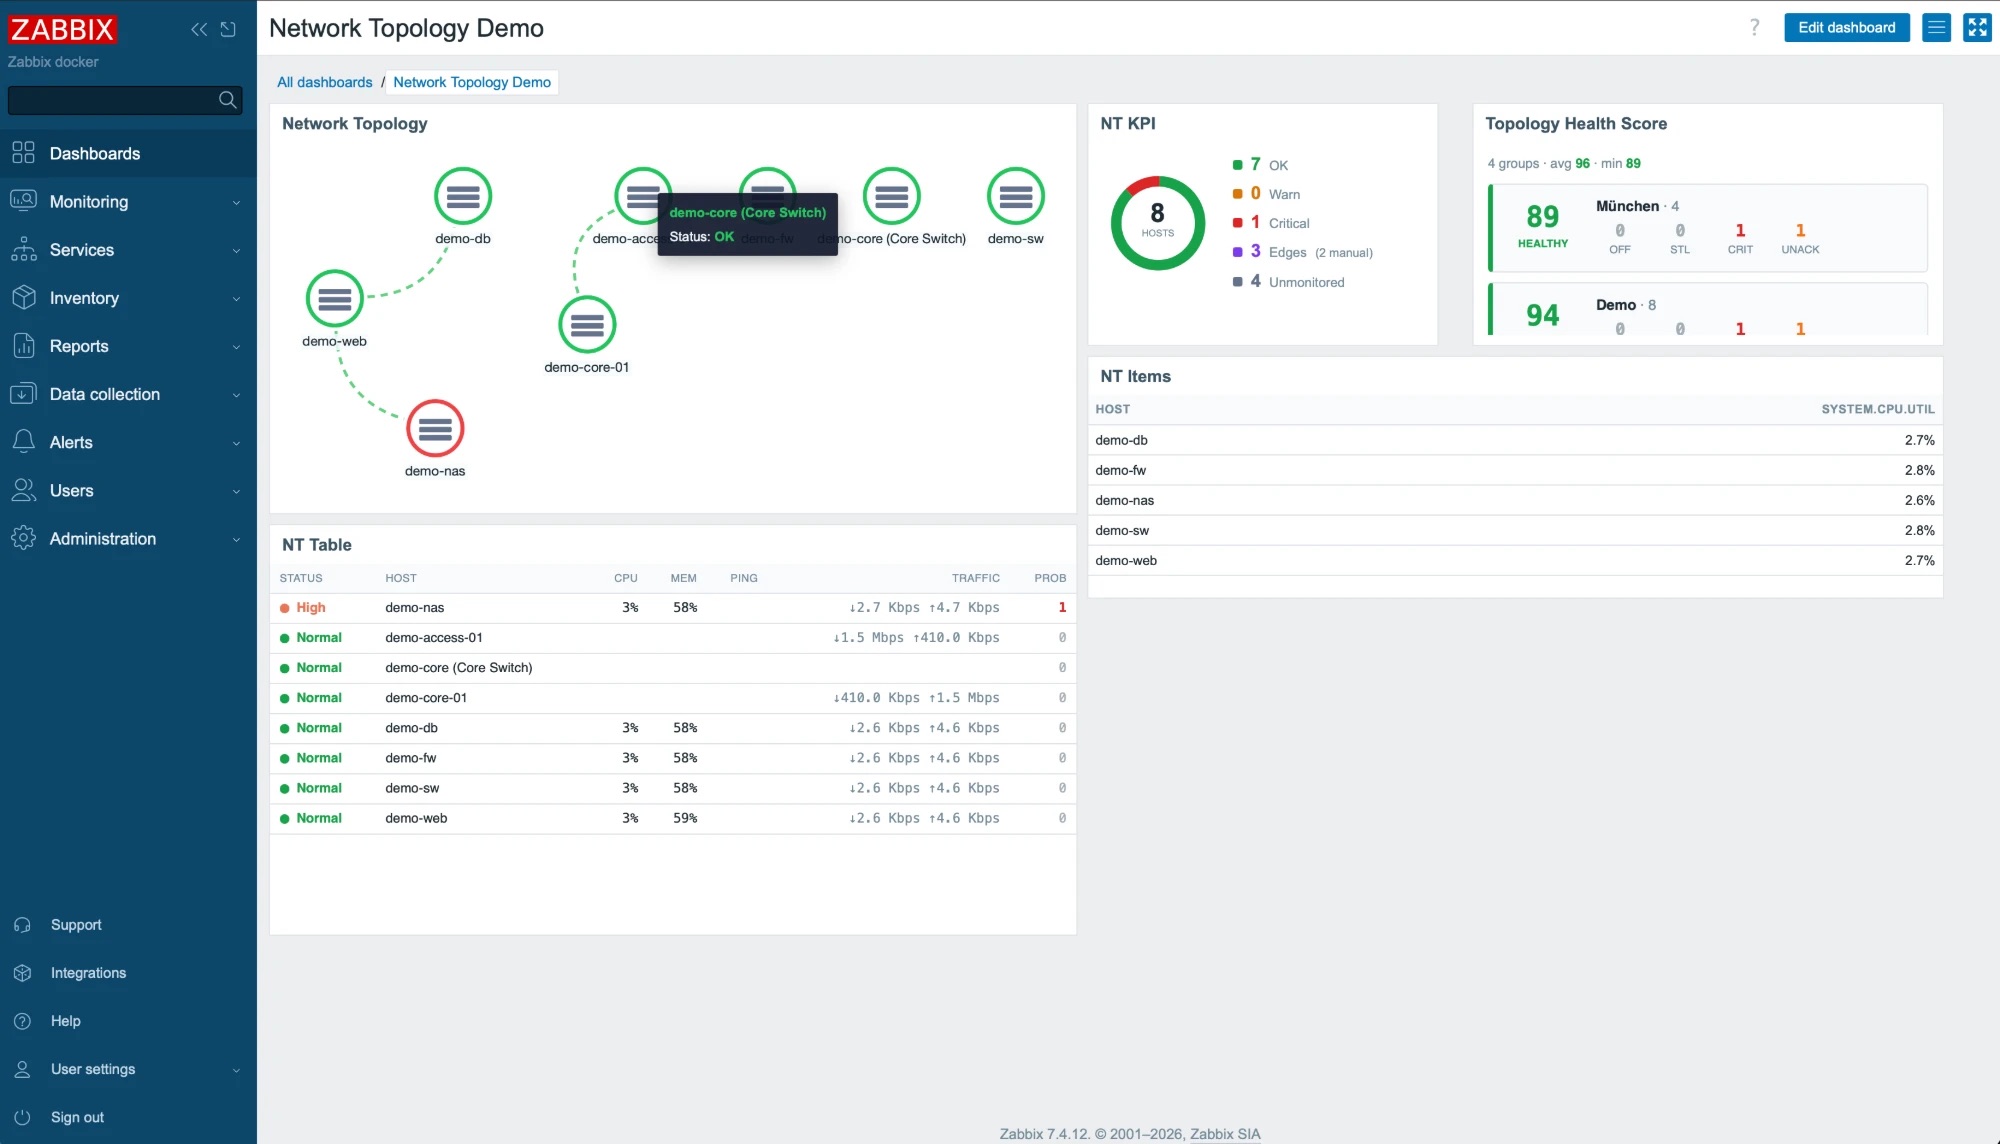 The whole module at a glance: the map plus four more dashboard widgets — a KPI ring, the Topology Health Score, an item list and the table.
🔎 Which port is that thing on?
This is the question support hears most — and it used to be manual labour: onto the switch, show mac address-table, bridge port, then the second switch, and in the end you have five hits and no answer. Because a MAC sits in the forwarding table of every switch on the path, on each one’s uplink.
New in the toolbar: a 🔎 MAC button. Type a MAC, and the answer is the access switch and its port — the one port where the MAC lives that is not an uplink. This module can do what a generic item can’t, because it already knows from LLDP which ports go switch-to-switch.
Two things we cared about:
- It stays API-only. The finder reads each switch’s FDB from Zabbix (four
walk[]items per switch, seeFDB-SETUP.md) — it does no SNMP of its own. Which means it also works for switches behind a Zabbix proxy that the frontend never reaches directly. - It stays honest. Instead of guessing, the panel lists every location including the uplinks, with a timestamp (FDB entries age — “found on port 18” is always a snapshot). If several access ports match, it says “ambiguous” and shows all candidates.
The uplink detection grew up along the way: at first it estimated the uplink from the FDB itself (a port carrying many MACs), which misreads a hypervisor port or a downstream switch. It now uses LLDP where the data exists — a port whose neighbour advertises Bridge or Router capability is an uplink — and only falls back to the heuristic otherwise. The panel says which method stood behind the answer.
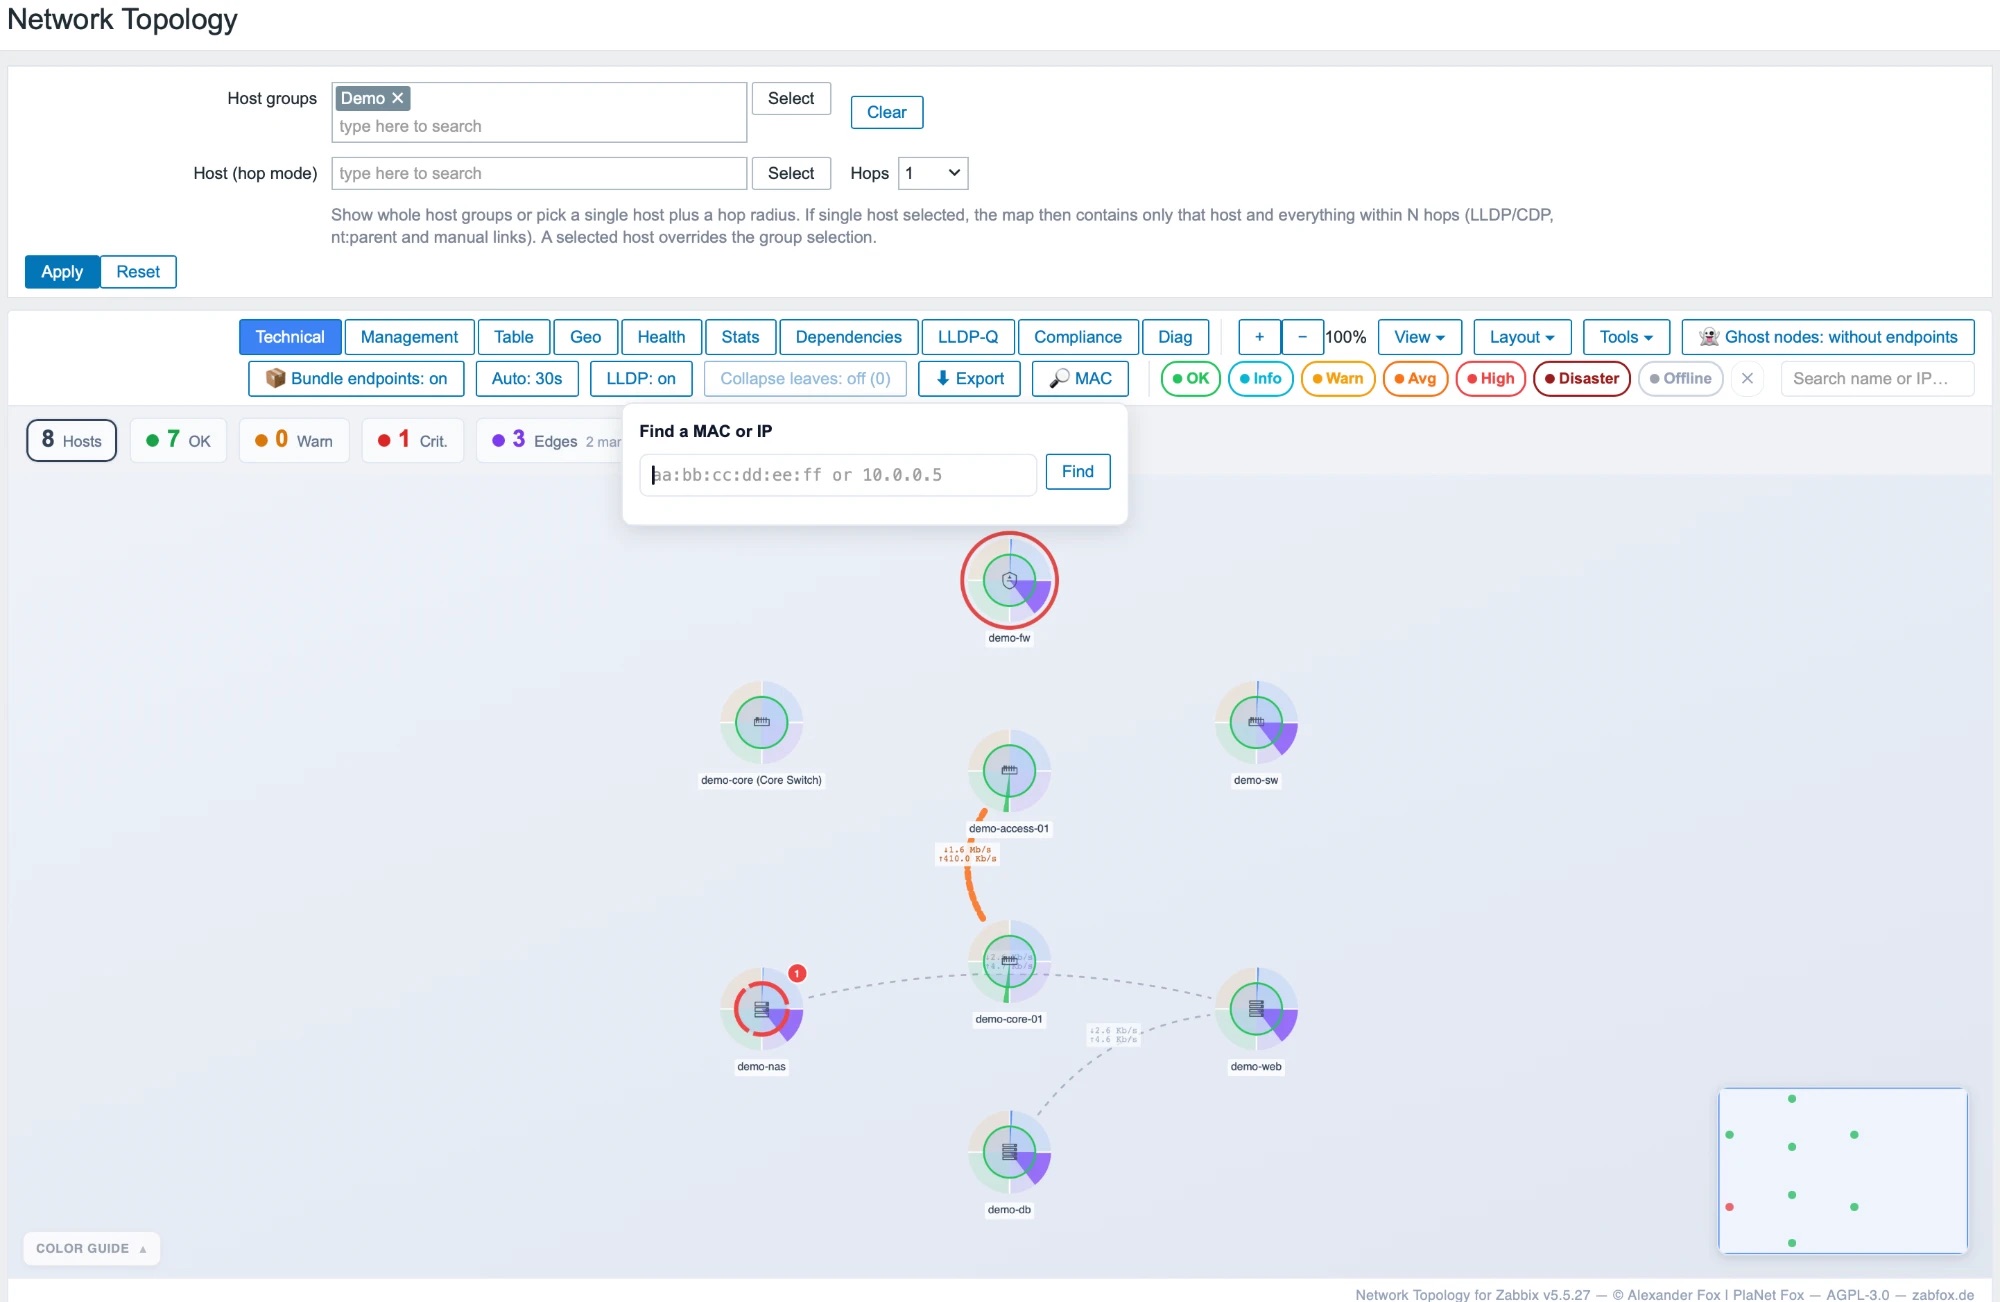 The 🔎 MAC button opens a small panel: type a MAC or an IP, and it names the access switch and its port.
Now by IP too — and even by IPv6
Most of the time you don’t know the MAC, you know the IP. So the finder closes the gap:
- By IPv4 (ARP). It resolves the IP to a MAC through the ARP table of a router/L3 switch, then runs the normal FDB lookup — one
walk[]item with keynt.arpon the gateway is enough. Several routers may carry it; the newest entry wins. The panel shows how the IP resolved and how fresh the ARP entry is. - By IPv6. A link-local or SLAAC address carries its MAC inside it (EUI-64, the
ff:fein the middle) — the finder pulls it straight from the address, no SNMP, no item. Any other IPv6 (privacy extensions, DHCPv6) resolves through the router’s ND table (nt.nd). Matching is on the canonical form, sofe80::1andfe80:0:0:0:0:0:0:1hit the same entry.
The whole IPv6 logic is pure and unit-tested — EUI-64 extraction including the U/L-bit check, so a privacy address that happens to carry ff:fe correctly falls through to the ND table instead of yielding a fabricated MAC.
Plus a fix from the community: an nt:lldp alias written as a MAC missed a neighbour that reported the same MAC in a different notation (AA:BB:… vs AA BB …). MAC-shaped aliases are now compared canonically — colon, dash, Cisco-dotted or bare, all the same device. Cleanly reported on GitHub (#24).
The map moves onto Zabbix 8
Zabbix 8 is around the corner, and its new dark-blue theme handed our dark mode a problem: it used one fixed GitHub-grey palette and sat on the navy UI as a grey island.
Now the module measures Zabbix’s actual background and text colour at render and derives its own tones from them — hue-preserving, so grey stays grey and dark-blue becomes navy. Backdrop, toolbar, canvas, detail panel, legend, tooltips, context menu and the MAC panel all follow. For Zabbix’s high-contrast dark theme it derives more sharply, so nothing fades to grey. Status colours (ok/warn/crit) stay fixed, and if the measurement fails the old static palette applies. Light mode is untouched.
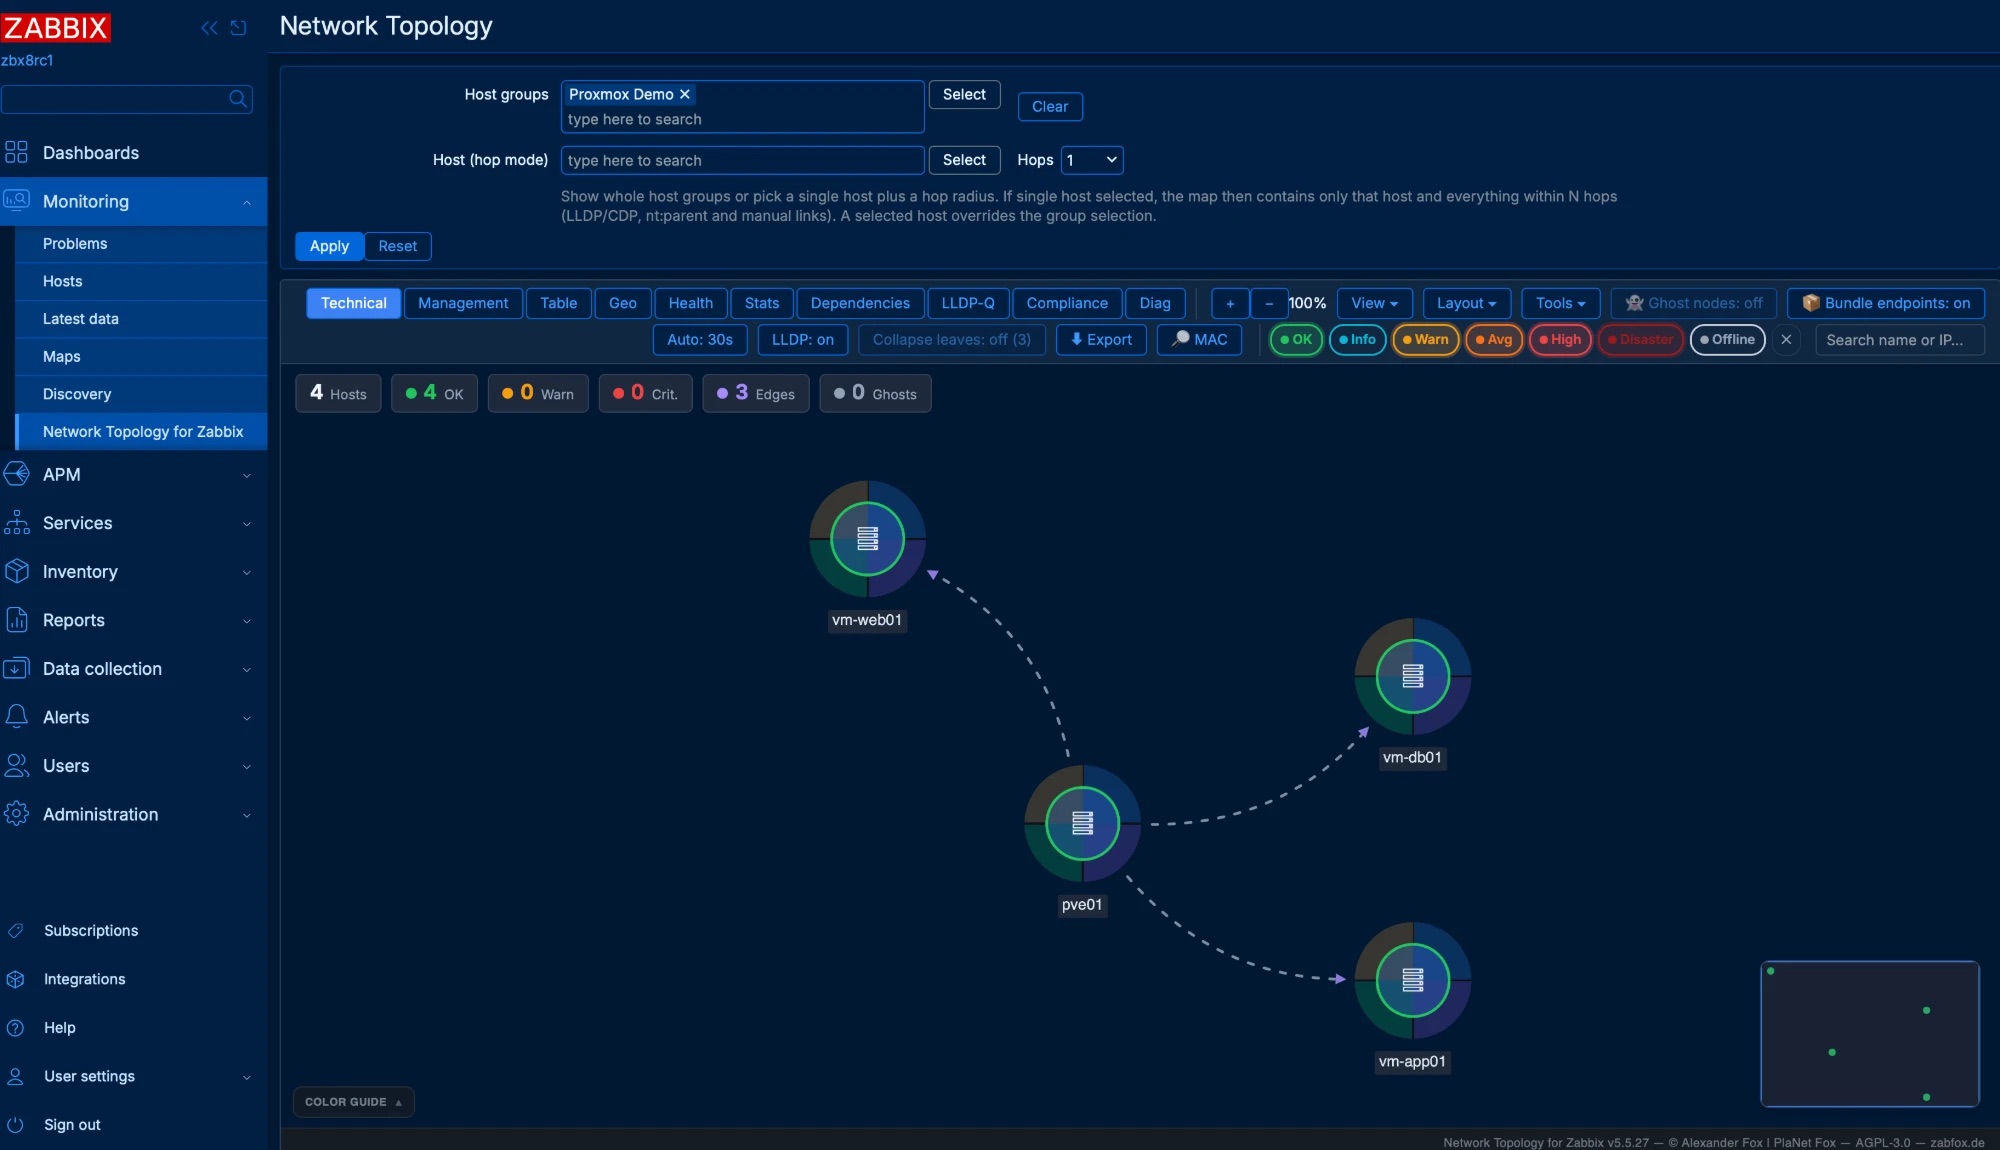 The same map in Zabbix 8’s dark-blue theme — the adaptive dark mode picks up Zabbix’s background and text colour, no grey island.
And then we cleaned up
Between the two big things ran a review wave (an external review plus findings from the field). Every finding was reproduced first, then fixed, and every fix shipped with a test that fails without it. The ones you notice:
- CPU: one correct source per host. Depending on item order a subcategory (7 % user) could beat the real total load (80 %). It now counts only the real total CPU — an honest “—” beats a wrong number.
- Concurrent saves no longer clobber each other. Shared links, positions and colour scales live in one config; if two people save different things at once, it now merges instead of overwriting.
- Privacy: the “what changed” list no longer leaks a host you’ve lost access to.
- Data quality made visible: a value that wasn’t collected now reads as “? not collected” instead of a healthy dash — drawn the same way in the node panel, edge panel, tooltip and table (measured / estimated / stale / unknown).
- The little stuff that nags: right-click no longer also opens the browser menu; label boxes are opaque so the text stays readable over the lines; the hop view no longer crashes with HTTP 500 on a failed host query.
Get it
5.5.27 is current. Upgrading within 5.5 means “swap the directory, reload once” — layouts, links, pins and notes all stay where they are. The MAC/IP/IPv6 finder is opt-in: it has no data for a switch until you add its walk[] items, and it says so. Releases & install →