Network Topology 5.5 — faster, nosier, and then we tried to break it
Main module and all five dashboard widgets run on Zabbix 7.0 LTS and 7.4. Grab it here: github.com/linuser/zabbix-network-topology/releases
5.5 didn’t land in one go — it’s really three releases with three different moods. 5.5.0 got fast. 5.5.1 got curious. 5.5.2 got paranoid. Here’s the short version of all three.
5.5.0 — three times faster (and we can prove it)
A full map of 1000 hosts, 1425 edges and 43 200 items used to take 4681 ms. Now it takes 1581 ms. Same map, same numbers on screen — just about a third of the wait.
And that’s not a demo with three devices in it. We stand up a lab of 1000 simulated SNMP devices — real LLDP neighbour tables, interface counters, the lot — and measure against that, because “fast” only counts at the size you’ll actually run. Every number above comes off that rig.
The fun part is how we got there, because we guessed wrong three times first:
- “It’s the edge-building, obviously.” Nope — 2 % of the time.
- “Then it’s the SQL chunk size.” Bumped it, got 13 %. Not the jackpot.
- “Fine, let’s just fetch fewer values.” Bad idea: those per-port values feed the host totals, so “17 ports down” would quietly turn into “2”. A map that’s fast and wrong is just wrong.
What actually worked: fetch the same values, differently — one windowed scan instead of a query per item. The step that ate 86 % of the load dropped to a quarter of it. (We wrote the new bottleneck into the changelog too, so nobody has to go hunting for it again.)
Oh, and it got easier to read: host groups now open one level at a time instead of dumping a thousand nodes at you, and there’s a NetBox cable export — the nice side effect being that NetBox checks every row for you, so your first import quietly tells you where your docs and your network disagree.
And when your “network” is really two or three sites, pick the host groups and the map draws each as its own labelled cluster — with the cables that cross between them kept visible.
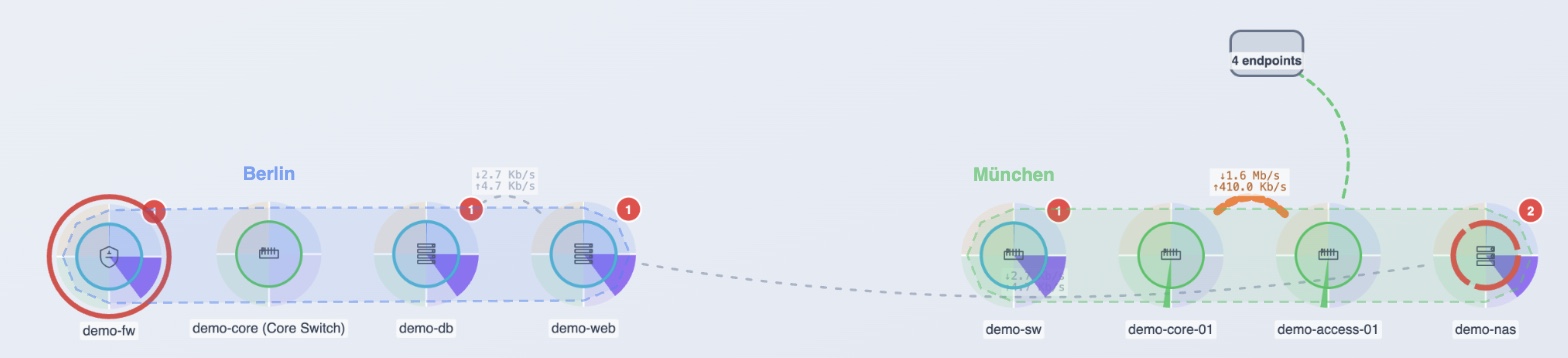 Pick two or more host groups and each becomes its own lassoed cluster; the links between sites stay visible. Here: Berlin and München.
5.5.1 — showing you more, for free
Everything new here is built from data the module was already pulling. No new items, no extra load.
- Forty endpoints, one node. A switch with a pile of workstations, phones and printers hanging off it used to draw forty little ghost nodes that told you nothing. Now they fold into one “N endpoints” bubble per switch — click to open. Real network gear (switches, routers, APs) never gets folded, so you still see the actual topology.
- Traffic and uptime, right on the cable. Hover or click a link and you get a tiny RX/TX graph for each end’s port, plus how long the link’s actually been up. It was all already being collected — we just started showing it.
- Turn a ghost into a host. Spotted a device over LLDP/CDP that isn’t in Zabbix yet? Make it a host straight from the panel, pre-filled and dropped right where it sits on the map. No name, just a MAC? We’ll look up the vendor for you — and say so honestly when the MAC is a made-up local one with no vendor behind it.
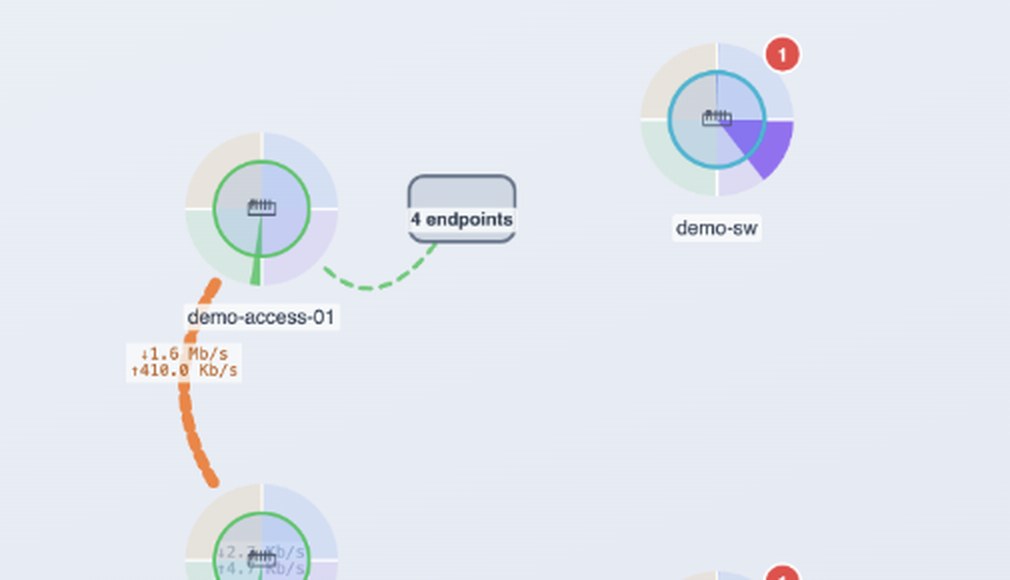 A pile of workstations, phones and printers collapses into one bundle — click to open it.
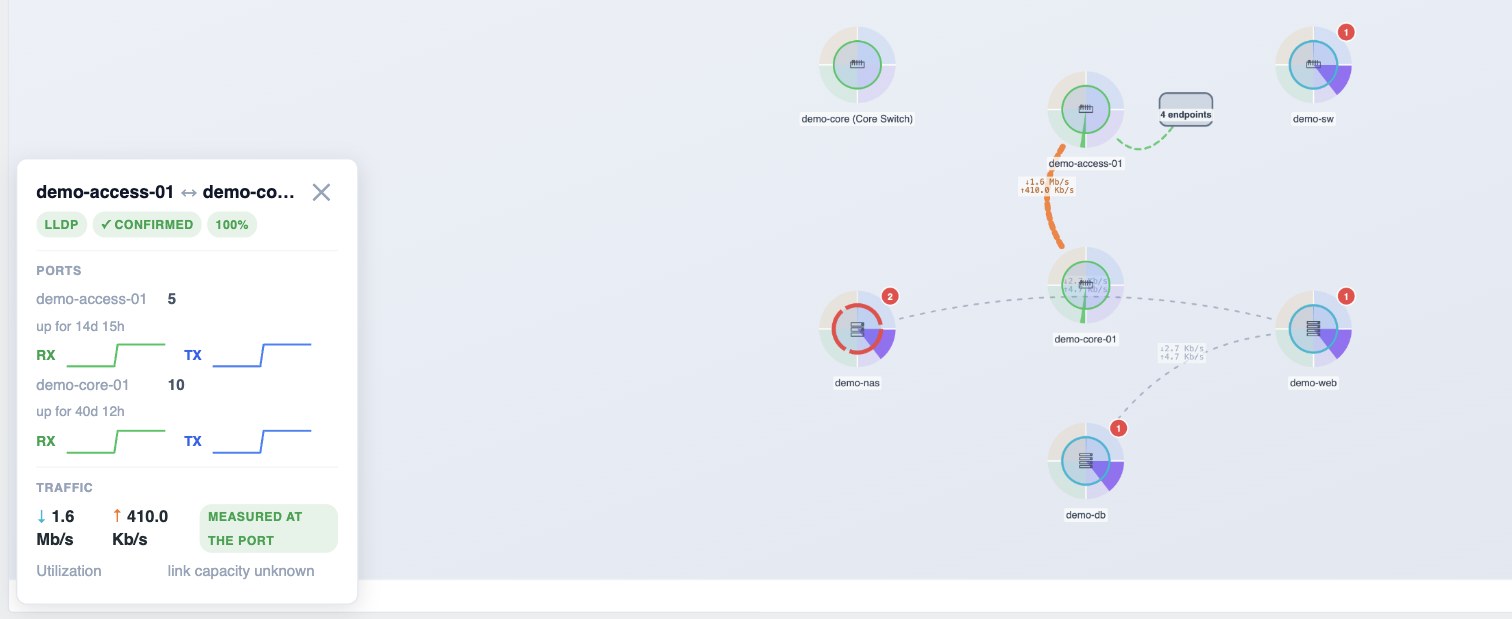 Click a cable and you get the recent traffic for each end’s port, plus how long the link has been up.
There’s also a fix we only caught on real hardware: a switch that reports everything over LLDP except its name used to vanish from the map completely. Every fake device in our test lab had a name — only a real one exposed the gap. It shows up now.
5.5.2 — green CI, and we still didn’t trust it
By 5.5.1 all seventeen CI checks were green. Which is exactly when you should get nervous — green only means the tests pass the tests you wrote. So we pointed six separate reviews at the whole thing at once (security, backend, frontend, colours, duplicated code, test coverage) and actually reproduced every problem before fixing it.
Good news first: no security hole. Everything that comes off the wire gets escaped, every write needs the full permission-and-CSRF song and dance, and you can’t trick the port probe into scanning hosts you can’t already see.
The real catches were two flavours of the same classic bug — drawing one cable as two:
- A device that mentions a neighbour without a port first, then with one was getting two edges instead of one — and flipping the order gave you one. So the count literally depended on what order Zabbix handed back the data. Fixed.
- The fake edges — the internet cloud and the new endpoint bubble — were being counted and styled like real measured links. They threw off the stats, painted over the bold internet line, and hovering a bubble fired off a history lookup for something that isn’t even a host. All sorted.
Plus a dark-mode one that no test would ever catch: a few status badges had bright text on a hardcoded pale background — great in light mode, nearly invisible in dark. Fixed with proper theme colours.
And then we taught the tests the lessons: new checks for things that quietly drifted before, including the untrusted LLDP neighbour names (the scariest data the module touches). Every fix came with a test that fails without it.
Go get it
5.5.2 is current. Upgrading within 5.5 is “swap the folder, reload once” — your layouts, links, pins and notes all stay put. Releases & install →