Documentation
Everything for installing, configuring and using the ZabFox modules.
Getting Started
Install and enable the Network Topology module in your Zabbix 7.0 LTS or 7.4 environment. No extra server — everything runs in the frontend.
# Into the Zabbix UI modules folder
cd /usr/share/zabbix/ui/modules

# Unzip release (directory name is mandatory)
sudo unzip ~/Downloads/network_topology.zip
sudo chown -R root:root network_topology

# Reload PHP-FPM
sudo systemctl reload php8.3-fpm
Ready in four steps
network_topology.Updating from a 5.x version? Replace the module files and reload php-fpm — a Scan directory is not needed, no new action was added.
Dashboard widgets · optional
Five widgets bring the module's data straight onto your dashboard: a topology graph, a health score per host group, a KPI donut, an item pivot and a Nagios-style host list. All five use the same data source as the main module — no second service, no extra configuration.
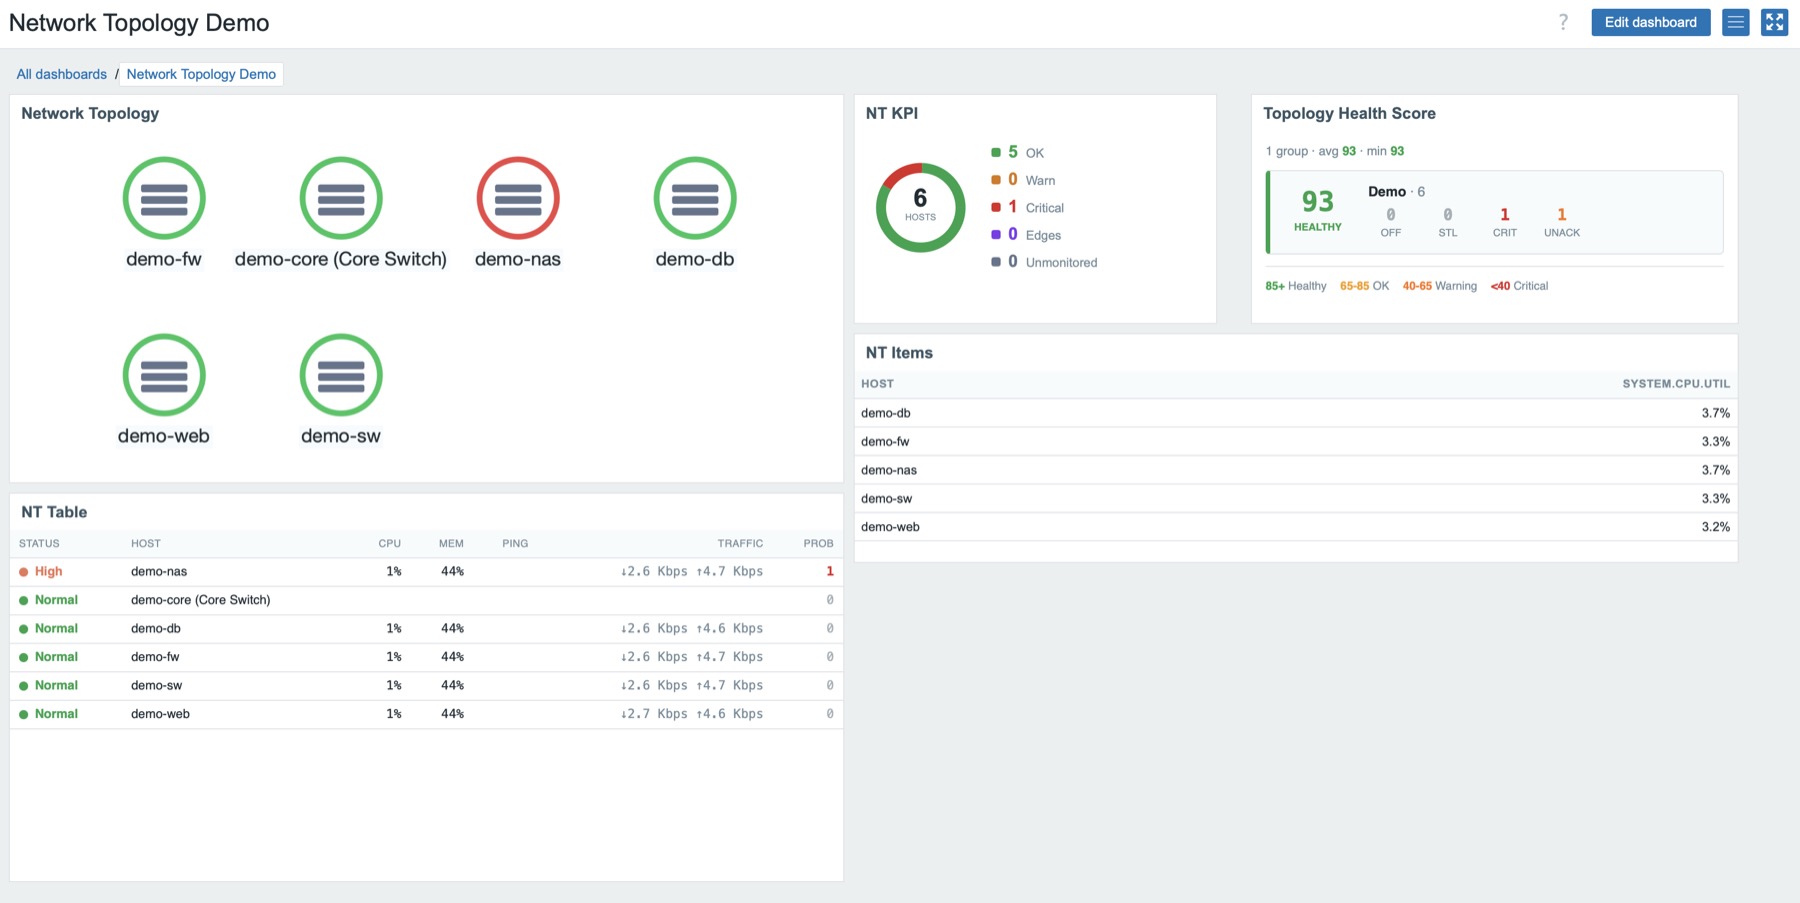
The five widget ZIPs are release assets on GitHub — unzip them into the modules folder:
# Into the Zabbix UI modules folder
cd /usr/share/zabbix/ui/modules

# Each widget into its OWN folder (-d) — the ZIPs have no top-level folder
sudo unzip network_topology_widget.zip -d network_topology_widget
sudo unzip network_topology_health_widget.zip -d network_topology_health_widget
sudo unzip network_topology_table_widget.zip -d network_topology_table_widget
sudo unzip network_topology_kpi_widget.zip -d network_topology_kpi_widget
sudo unzip network_topology_items_widget.zip -d network_topology_items_widget
sudo chown -R root:root network_topology_*

# reload php-fpm (service name depends on distro/PHP version)
sudo systemctl reload php8.3-fpm
Then go to Administration → General → Modules → Scan directory and set the five modules to Enabled. They then appear in the dashboard editor under “Add widget”.
FAQ
Does the module need an extra server?
No. Network Topology runs entirely in the Zabbix frontend as a PHP module — no extra service, no separate server.
Which Zabbix version is supported?
The main module and the five dashboard widgets run on Zabbix 7.0 LTS and 7.4. Older versions are not officially supported.
Is ZabFox free and open source?
Yes. The Network Topology module is released under AGPL-3.0 and free to use.
How do I install the module?
Unzip the release into ui/modules/ (folder network_topology), reload php-fpm and enable it under Administration → Modules — about two minutes.
Which views are there?
Four: Technical (force graph), Management (wallboard), Table (host list/pivot) and Geo (Leaflet map) — from the same data.
What’s new in the latest version?
v5.4.0 draws parallel cables individually: a LACP bundle fans out on zoom into one edge per cable — each with its own ports, traffic and utilisation — and a failed member is reported on its own instead of vanishing into the combined edge. The table now shows the far-end device and port (sortable, filterable, with CSV export). Before that, v5.3.2 brought the reporter fixes (no false edges from short MAC names/duplicate IPs) and the nt:uplink/nt:lldp tags, and v5.3.0 the per-edge detail panel, confidence scoring and GraphML export. Since v5.0.0 the module is uniformly called network_topology.
What about devices that don't report topology at all — unmanaged switches, firewalls without LLDP?
It depends on the device, and there are two distinct cases.
An unmanaged switch is usually invisible. It doesn't speak LLDP, but it forwards the frames because it never processes them. So the managed devices on either side see each other and appear directly connected on the map. Topologically that's wrong — but the statement "these two are connected" still holds.
A firewall without LLDP is the more awkward case. Zabbix monitors it, so it shows up as a node — but with no edges. It sits on the map as an island, even though half your traffic passes through it.
How to fill the gaps:
- Host tag
nt:parent=<hostname>— the recommended route. Add a tag on the host naming the device it hangs off, e.g.nt:parent = fw-core. It's a regular Zabbix host tag, so it lives server-side and every user sees it. Designed for carrier relationships (VM→hypervisor, container→node), but works just as well for "this host sits behind that firewall". The failure simulation treats it as a hard dependency: if the parent dies, the child dies — regardless of the network path. - Manual links drawn straight into the map (star mode). Quick for your own view. Caveat: they live in the browser's
localStorage, so they're per user and per device — your colleague won't see them. For documenting a shared topology, the tag is the right tool. - Ghost nodes cover the reverse case: if a neighbour reports a device that isn't monitored in Zabbix at all, it appears as a dashed placeholder. The gap becomes visible instead of disappearing.
Important for the failure simulation: it only knows the edges it has been given. A device that isn't in the graph can't be simulated as a point of failure — and a hand-drawn edge that doesn't match reality will make the simulation confidently wrong. For the paths that actually matter, it's worth checking: are those edges measured, or assumed?